

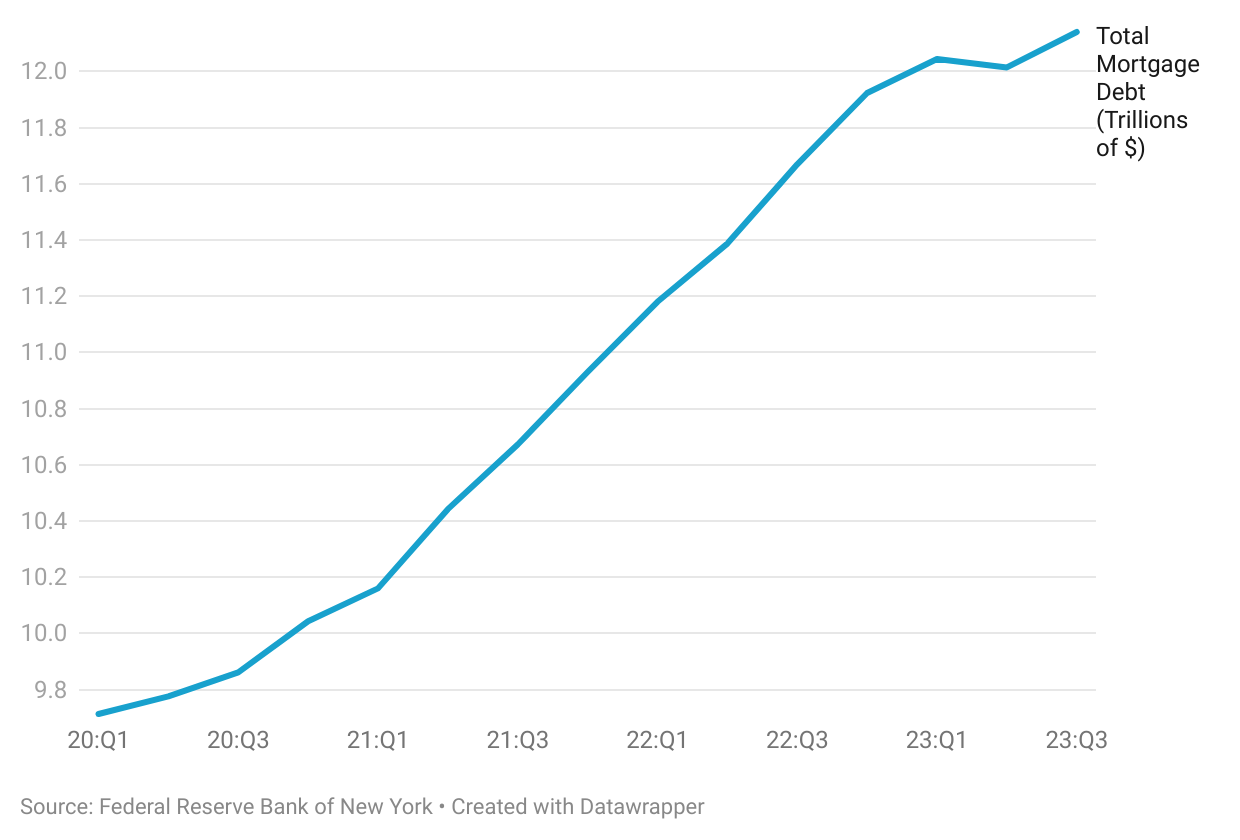
The current housing market is characterized by a historically low supply, driven in part by the surge in homeowners locking in low-interest rates in 2020 and 2021. A substantial majority, nearly 60%, of existing mortgages boast contract rates below 4%, with an additional 20% falling in the 4%-5% range. New York Fed research indicates that approximately one-third of the mortgage balance underwent refinancing during Q2 2020 – Q4 2021, complemented by a further 17% refreshed through property sales. Although the total mortgage debt witnessed significant growth of $282 billion in Q2 2021, the momentum slowed to $126 billion in Q3 2023. This deceleration can be attributed to reduced origination activities, both in purchases and refinances, amid a period where mortgage rates averaged 7%.
Credit Quality
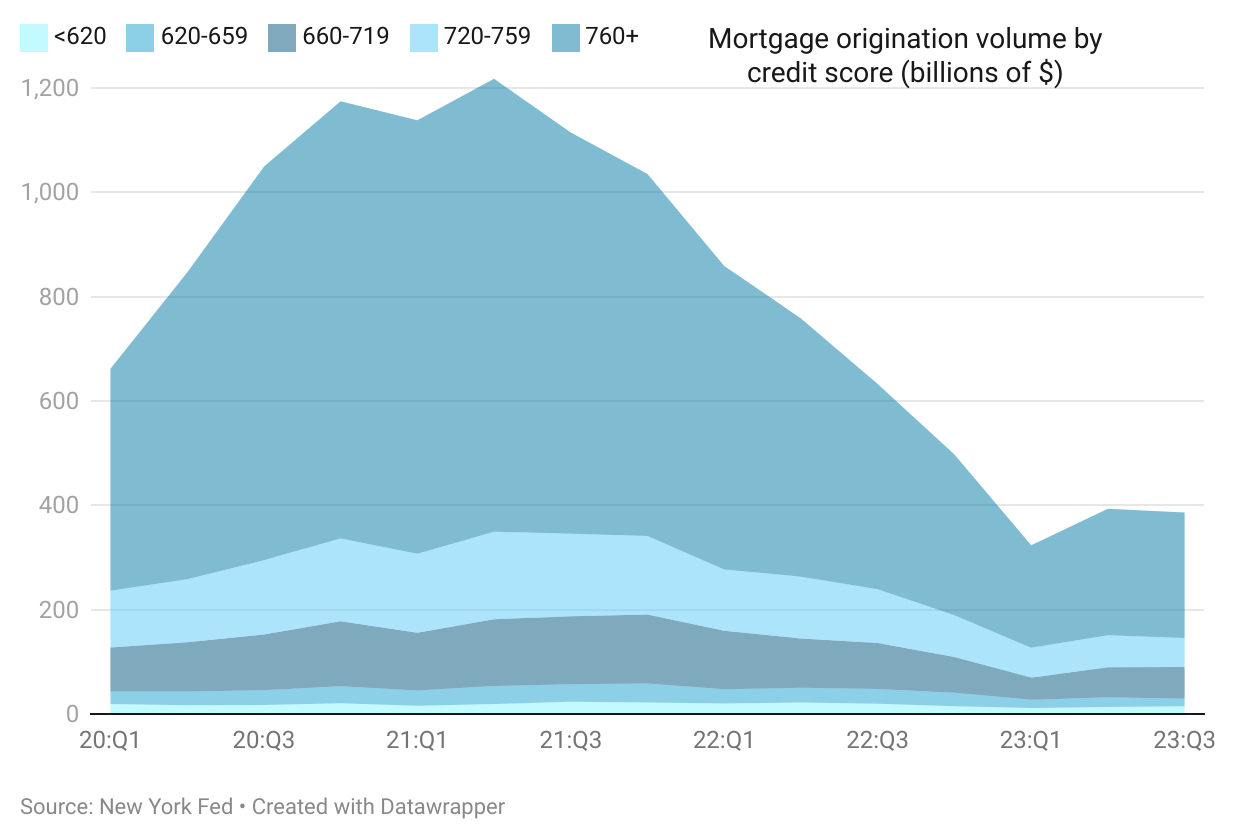
There has been a shift in the borrower risk profile from Q1 2021 to Q3 2023. Notably, there has been a decrease in the percentage of mortgage loans extended to consumers with a credit score of 760 or higher, declining from 73% to 62%. Concurrently, there has been an uptick in mortgage loans granted to consumers within the 660-719 credit score range, rising from 10% to 16%. Furthermore, the proportion of borrowers possessing a credit score lower than 660 has increased from 4% to 7.6%. Presently, individuals acquiring new mortgages are encountering elevated monthly mortgage payments. Furthermore, household debt surged by $564 billion between Q1 2021 and Q3 2023, driven by an increase in various other categories of household debt. Consequently, there is a downward trend in consumer credit scores.
Foreclosure Rates
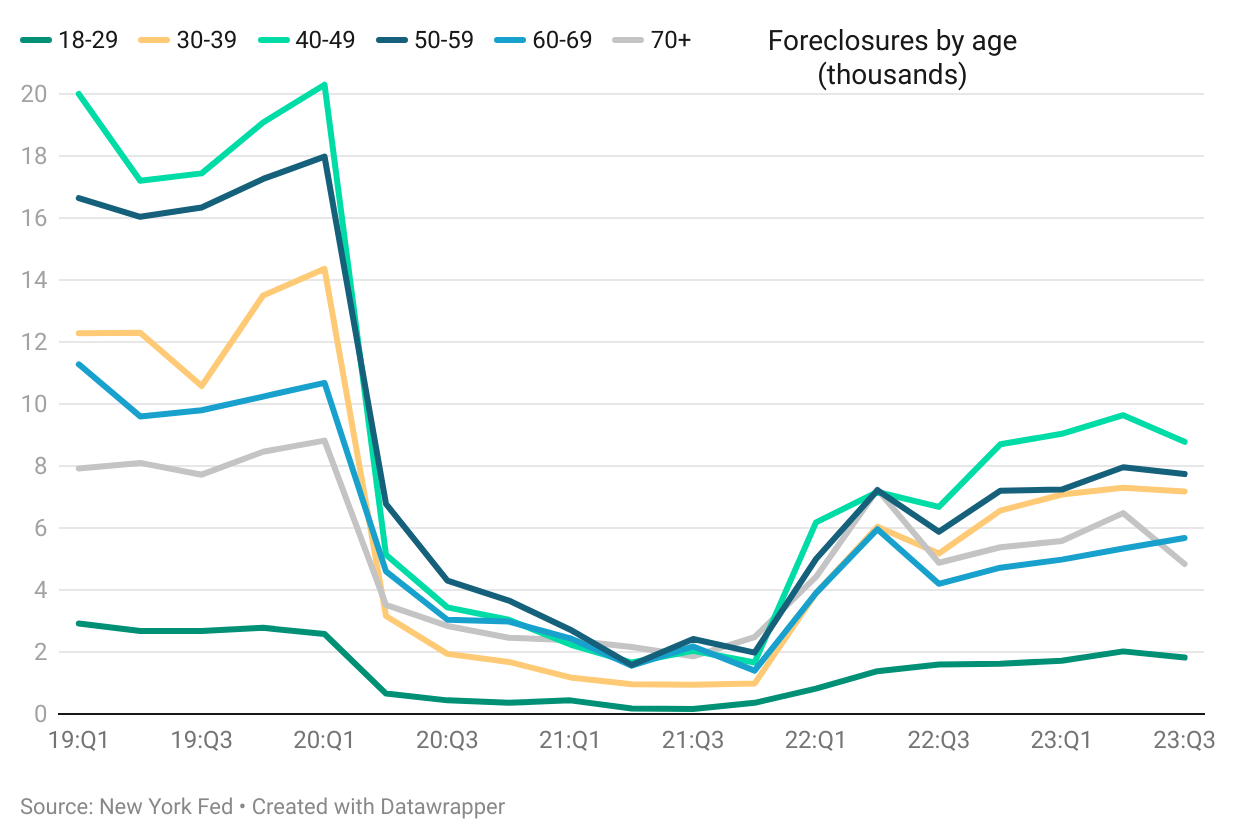
Financial pressures stemming from larger loan balances are contributing to a rise in foreclosure numbers. However, it’s important to note that the current foreclosure figures are significantly lower than those observed in Q1 2020 (74,160). The government had implemented a moratorium on foreclosures in response to the severe economic downturn and increased unemployment during the initial pandemic phase. New foreclosures declined from 23,860 in Q2 2020 to 8,100 in Q2 2021 and then increased again to 36,100 in Q3 2023.
Analyzing the distribution of new foreclosures by age since the onset of the pandemic (Q2 2020), there is a decline in the percentage for the 50-59 age group (from 28.4% to 21.4%), the 60-69 age group (from 19.3% to 15.8%), and the 70+ age group (from 14.8% to 13.4%). Conversely, there is an increase in this percentage for the younger age groups.
Conclusion
While the labor market is displaying some signs of weakness, the unemployment rate remains comfortably below 4%. Moreover, increasing incomes have contributed to maintaining a positive balance sheet for the average household. Over time, households’ liabilities as a percentage of disposable personal income have decreased from 101% in Q1 2020 to 99.8% in Q3 2023. Concurrently, assets as a percentage of disposable personal income have risen from 772% to 843%. Additionally, the percentage of mortgage loans transitioning into serious delinquency (90+ days) reduced from 1.17% in Q1 2020 to 0.72% in Q3 2023. Although mortgage rates are anticipated to remain above 6.5% in 2024, exerting pressure on the housing market and the mortgage industry, the robust economy and healthy consumer credit suggest the current market is fundamentally strong.

About Reena Agrawal, Research Economist
Reena Agrawal received her PhD in Economics from Vanderbilt University and MA in Economics from The Ohio State University and has several years of industrial experience in economic research and analysis.