New United States weather data shows ‘obvious’ effects of climate change at a time when catastrophic events have intensified.
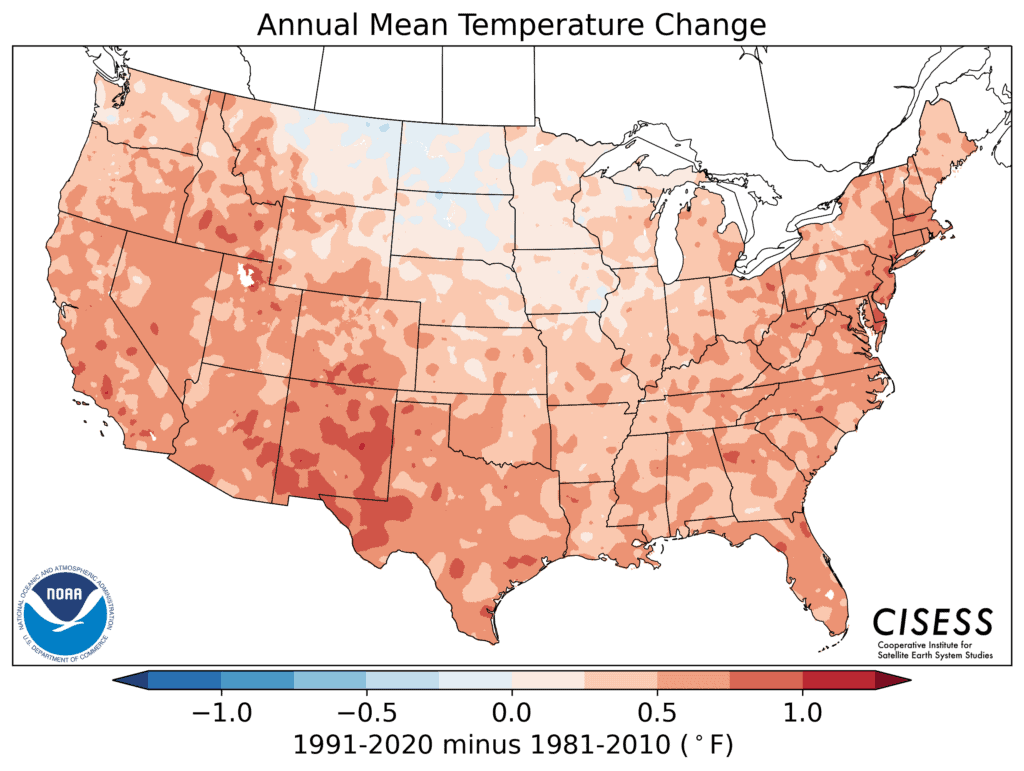
Weather data recently released by the National Oceanic and Atmospheric Administration, a U.S. scientific agency that tracks weather data, shows that the U.S. is getting warmer and parts of it are getting wetter.
Every ten years, NOAA releases an analysis of U.S. weather from the past three decades that calculates average values for temperature, rainfall, and other conditions. The report details data from 1991 to 2020 and updates what is defined as climate “normals” over the past 30-year period – allowing weather conditions to be put into “historical context”.


Simply stated: the normals are the basis for judging how daily, monthly, and annual climate conditions compare to what is typical for a specific location in today’s climate.
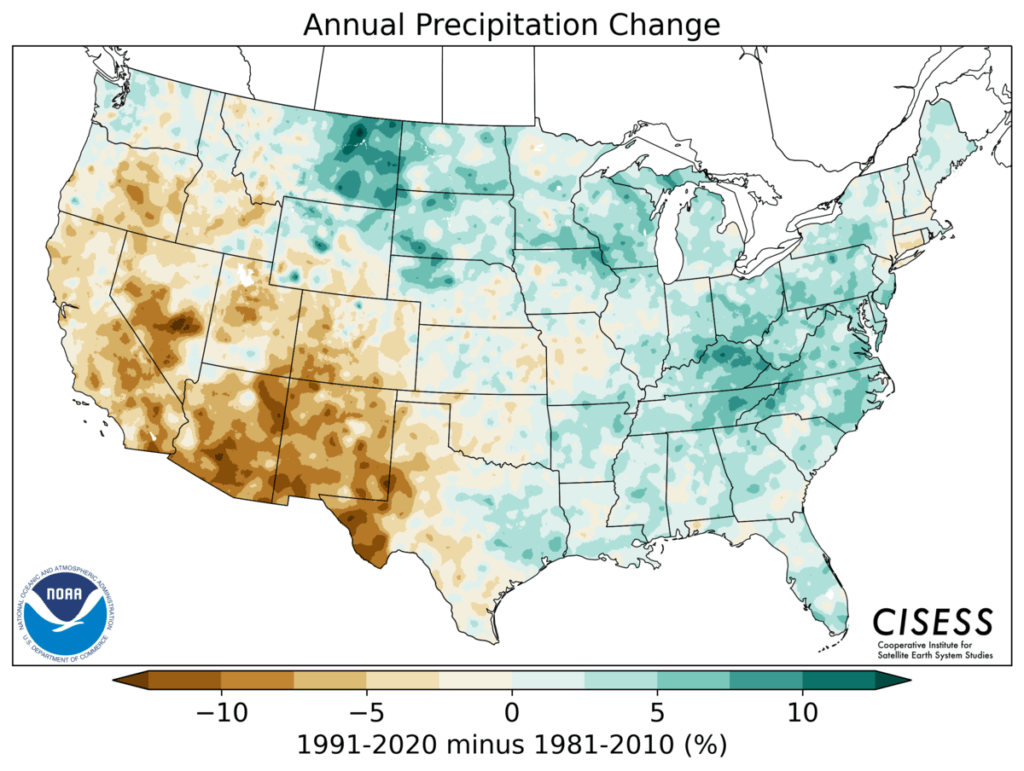
What does the data tell us about the U.S. climate? Western and Northern states are clearly warming faster, while the Southeast isn’t. In much of the West, the terrain is generally dry. This means as the climate warms, more of the excess heat from rising temperatures directly cycles back into warming the air, not evaporating moisture. In the Southeast, the opposite is true. In this moisture-laden climate, much of the heat is used to evaporate water rather than directly heating the air, explaining the slower rate of temperature warming and excess precipitation.
The NOAA data shows a clear trend of increased moisture in the East and drought in the Southwest. In addition, a warmer Gulf of Mexico allows more water to be evaporated and transported northward, falling as rain and snow. The more precipitation that hits the ground, the more water is re-evaporated to create even more moisture.
In the Southwest, we see the opposite side of the cycle. As precipitation becomes less consistent due to climate change, the ground becomes drier. With less moisture on the ground, air temperatures increase, drying out the land even more. The lack of soil moisture means less rain falls locally. This pattern is a contributing factor to why the region is going through one of its worst droughts in modern history.
Shifting the baseline for normal temperatures highlights just how quickly climate change affects conditions on our planet. Altered precipitation patterns across the country intensify wildfire seasons, threatens water supplies for people and agriculture, and exacerbates hurricane formation.

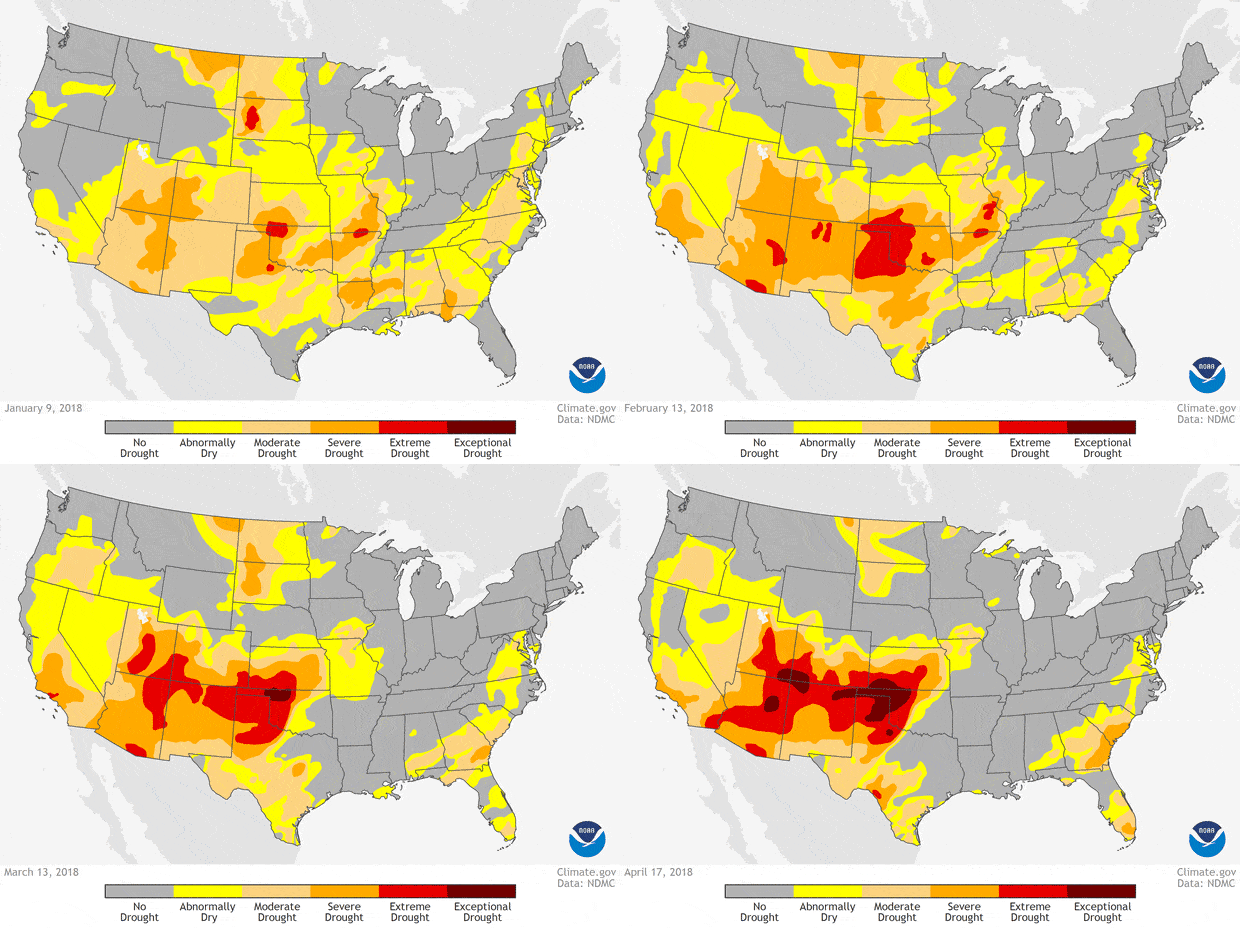
U.S. drought conditions on January 8, February 13, March 13, and April 17, color coded from yellow (abnormally dry) to dark red (exceptional drought). NOAA Climate.gov animation, based on data from the US Drought Monitor project.
Source: Climate.gov
Climate change is also correlated to 2020’s incredibly brutal hurricane season and is driving yet another perilous 2021 season. Colorado State University, one of the nation’s top seasonal hurricane forecasters, predicts that 17 named tropical storms will form in 2021, eight of which are expected to become hurricanes.
Understanding and mitigating climate risk is a complex and evolving challenge for real estate investors. Leaning on tools that provide an accurate valuation of a home in a disaster area can help investors better manage the impact a disaster has had on their property portfolio. Veros monitors natural hazard activity and provides post-disaster impact assessments for mortgage lenders and servicers, real estate professionals and commercial property stakeholders. The ability to know precisely which properties are likely to have been impacted gives real estate professionals fast and reliable data so they may better serve their clients amidst an ever-growing reality.
When disaster strikes…how strong is your residential or commercial property portfolio? Veros knows. Now you can too.
Sign up for disaster alerts by Veros and receive our 2020 Disasters in Review Report.


