
For many Americans, the dream of homeownership is slipping further out of reach. Over the past five years, home prices have increased much more than household incomes, creating the widest affordability gap in decades. Despite a cooling housing market and modest declines in mortgage rates, the cost of buying a home remains far beyond what most middle-income families can afford.
Incomes Have Stagnated While Prices Have Soared
Between 2019 and 2024, U.S. home prices rose dramatically, outpacing both wage growth and overall inflation. According to the Federal Housing Finance Agency (FHFA), national home prices climbed about 47% from 2019 to 2024. Meanwhile, median household income increased by just 22% during the same time.
While housing costs surged during the pandemic housing boom, driven by low rates, supply shortages, and remote work migration, wage growth failed to keep pace. The problem is not just higher prices; there are also higher borrowing costs. After years of near-zero interest rates, mortgage costs surged as the Federal Reserve raised rates to combat inflation. While rates have recently eased to around 6.3% for a 30-year fixed mortgage, they remain more than double their 2021 lows.
The Geography of Unaffordability
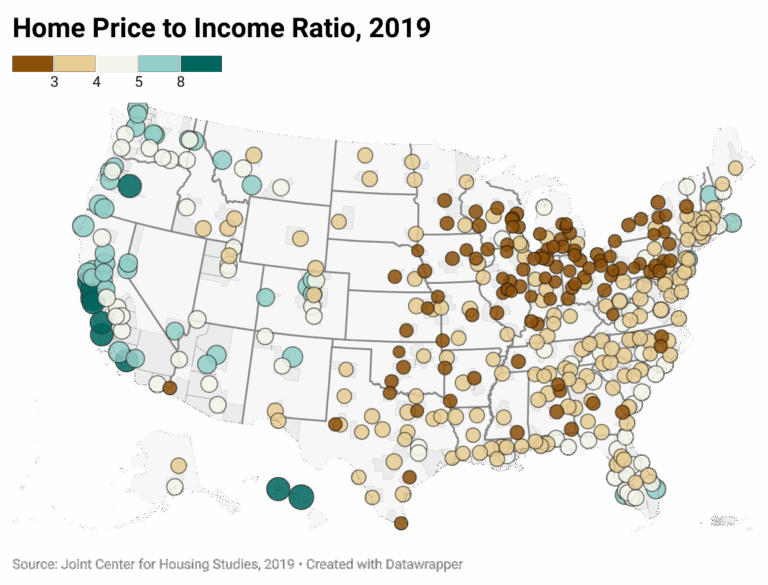
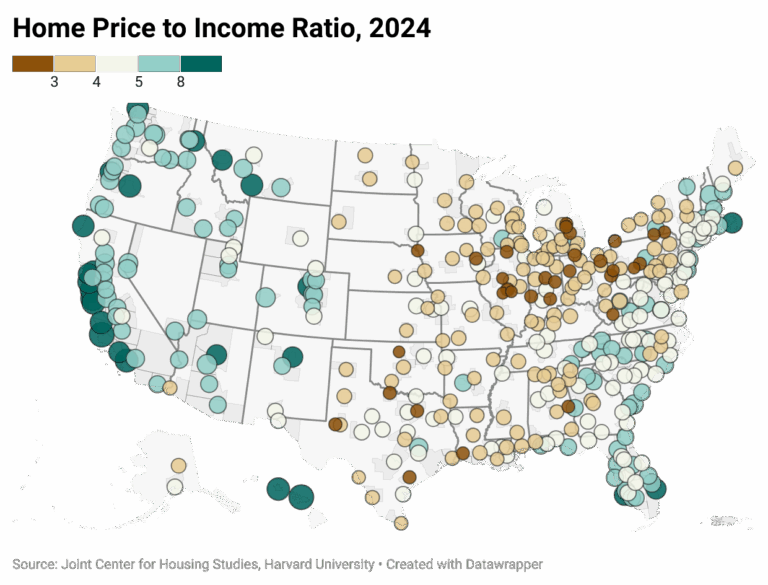
Housing affordability has worsened across nearly all major U.S. metros, but some areas are in far deeper crisis than others. The least affordable markets remain concentrated along the coasts and in fast-growing Sun Belt regions. In 2019, there were 139 metros with a home-price to income ratio of 3 or less. This number dropped to just 38 in 2024. In California markets such as San Jose, Santa Cruz, and Santa Barbara, the home price to income ratio was above 12 in 2024.
By contrast, some areas in the Midwest and Northeast remain comparatively attainable. Cities such as Pittsburgh, Detroit, and St. Louis are among the few large metros where the median household can still afford a median-priced home (home price to income ratio of less than 4), thanks to lower home values. These regions are seeing renewed interest from first-time buyers priced out of coastal states.
Home Price to Income Ratio Comparison of 2019 and 2024
The Outlook for 2025 and Beyond
While mortgage rates have eased slightly in late 2025, meaningful affordability improvements are unlikely without significant changes in supply or income growth. The Federal Reserve Bank of Atlanta’s Home Ownership Affordability Monitor (HOAM) provides a monthly measure of the median-income household’s capacity to afford the median-priced home, which was at 47% in August 2025. This was much higher than the affordability threshold of 30%. HOAM’s Affordability Index, where an index value of 100 or above indicates a median-income family could afford a median-priced home, was at 64 in August 2025, compared to 102 in December 2019.
Even a modest drop in rates may simply reignite demand and put renewed upward pressure on prices, rather than bringing relief to buyers. For now, affordability remains a tale of two Americas: coastal and Sun Belt metros where middle-income buyers are locked out, and Midwest markets where steady prices still allow for sustainable ownership. Unless wage growth begins to catch up or construction meaningfully expands, the gap between home prices and household incomes is likely to persist well into 2026.

About Reena Agrawal, Senior Research Economist
Reena Agrawal received her PhD in Economics from Vanderbilt University and MA in Economics from The Ohio State University and has several years of industrial experience in economic research and analysis.